


Patrick Christie: A tale of four Investors
Where should I put my money? This seems like a simple question, but it is faced by every investor and saver, writes Patrick Christie.
The short answer is no one knows. It is simply not possible to predict next year which asset class will perform best. Will it be equities, property, government gilts or something else entirely? We simply don’t know. Anyone who tells you they can look into the crystal ball of the financial markets and predict where the next bull market will be is, at best, deluded.
Whilst we can’t predict the best performing asset class (let alone individual stocks), we can say with a considerable degree of certainty what will do best on average. We can do this by examining the wealth of available data on various asset classes, aware that the longer you invest in any asset class, the more it will behave like its average.
Let us consider four investors; one invests in the stock markets, one in UK property, one in US property, and the last in gold.
We will look at these investments across rolling 20 year periods (a reasonable investment time frame). We are not looking for the asset class with the highest return in one 20 year period, but rather the one that consistently comes top in the 20 year period. When you invest it is best to do so in the asset class with the highest chance of coming top.
Beginning in 1991 (the first year of available data for all the investments), we will compare all our asset investments with inflation (RPI) as, if the investment beats inflation, it is in real terms not losing money.
For ease, all gains will be shown before the impact of tax. However, it is worth noting money invested in stocks can be gradually moved to ISAs, allowing tax-free investment growth, and, when withdrawing, no capital gains tax (CGT) It is also worth noting, any property and gold gains would be eroded by CGT. In addition to taxes, as we will only look at the capital growth of assets, you would also need to consider the rents and maintenance costs from property, storage charges for bullion, and dividend gains and management charges for stocks.
For stocks, we will use the MSCI World Index (an index of all publicly traded companies), for both property markets, the relevant housing prices index (HPI), and, for gold, the price of gold. For inflation, we are using RPI as our benchmark.
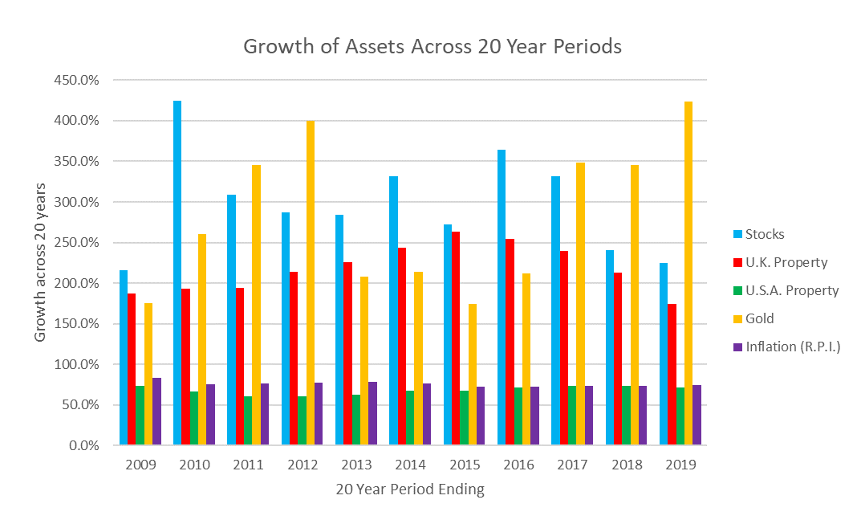
Stocks are our winner with the highest gains just under 60% of the time, and the second best investment approximately 40% of the time. Whilst gold comes top 5 times, pay attention to where it comes when it is not first. It is also worth looking at the graph below to see if you could stomach the rocky ride gold takes you on.
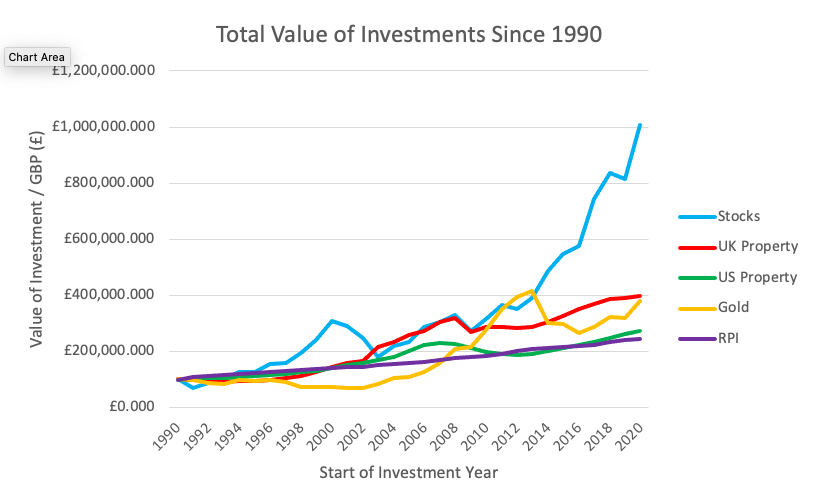
In monetary terms, if you invested £100,000 in 1991 into each asset class, in 2020 you would have (before any applicable taxes):
- Stocks: £1,007,000
- UK Property: £399,000
- US Property: £274,000
- Gold: £380,000
- Inflation (our benchmark): £245,000
All of the investments beat inflation so wherever you put your money, the capital value has not been eroded in real terms (although there were several 20 year periods where US property did not beat inflation).
Whilst it is impossible to say definitively where you should put your money, it does appear that investing in stock markets will give you the best chance of success.
Patrick Christie is a graduate intern at Wealthflow